The problem is that the market is crowded, and not all tools are created equal. Some are incredibly powerful but built for enterprise budgets that most teams don’t have. Others look affordable until you actually try to set them up. And plenty of them look great in a demo but leave you missing exactly what you need most once you’re in production.
This post isn’t a sales pitch. What I want to do is give you the objective criteria you should evaluate before choosing a database monitoring tool, so that whatever decision you make is the right one for your environment.
7 criteria for choosing a database monitoring tool
1. Real-time data with historical records
This is the most important criterion — and the one most often overlooked.
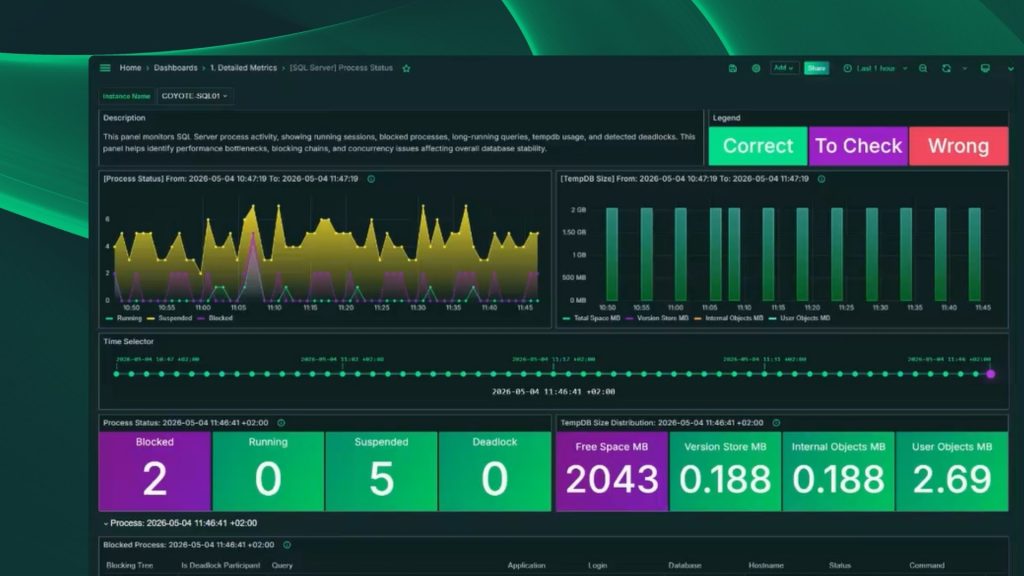
Real-time monitoring means seeing what’s happening right now: active queries, current blocking, CPU and memory usage. Any halfway decent tool does that. The real differentiator is whether the tool also stores historical data.
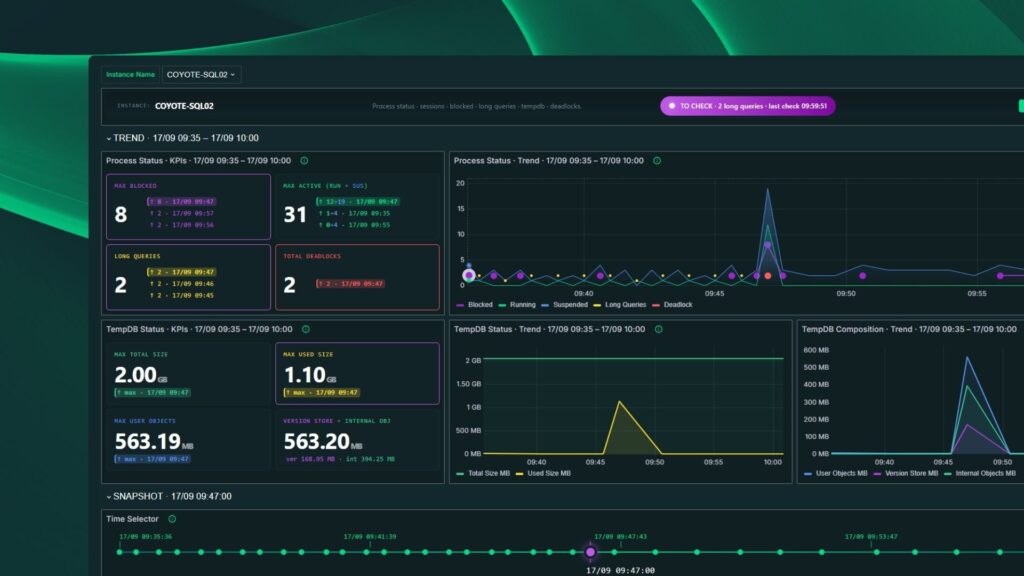
Why does history matter? Because the most serious incidents don’t always happen when you’re sitting in front of the server. The blocking chain that brought down the app at 3 a.m., the query that maxed out CPU last Tuesday right before users started complaining, the table that’s been growing at an alarming rate for months — none of that is visible by the time you sit down to investigate. It’s already gone.
A tool that only shows you the current state is useful. A tool that also keeps a history of processes, blocking events, performance counters, and growth trends is essential.
2. Real coverage of your environment
Here’s something many tools don’t handle well: not every organization runs a homogeneous environment. More and more teams manage mixed setups, with on-premises databases and cloud databases running side by side.
A tool that covers on-premises well but leaves you blind in the cloud isn’t a complete solution. The same goes the other way: tools built purely for cloud environments that don’t cover the on-premises instances you still have running.
3. Proactive alerts, not reactive ones
There’s a huge difference between finding out about a problem when a user calls you and finding out when your monitoring tool warns you with enough lead time to actually do something.
A database monitoring tool without intelligent alerting forces you to keep an eye on the dashboard at all times. That doesn’t scale. What you need is a tool that detects anomalies, crosses configurable thresholds, or identifies dangerous trends — and notifies you before the problem hits production.
Alerts need to be configurable. Generic thresholds that can’t be tuned to your environment are nearly useless. And they need to cover the scenarios that actually matter: prolonged blocking, queries with unexpected execution plans, abnormal database growth, failed jobs, resources running near their limits.
4. Minimal impact on monitored servers
A database monitoring tool that slows down the servers it’s monitoring is like a doctor that makes patients sick. It sounds obvious, but it’s a real problem with tools that use aggressive polling or run heavy queries to collect metrics.
Before deploying any tool in production, ask how it collects data, how frequently, and what the measurable impact is on server resources. If you don’t get a concrete, verifiable answer, that’s a red flag.
5. A global view, not server-by-server navigation
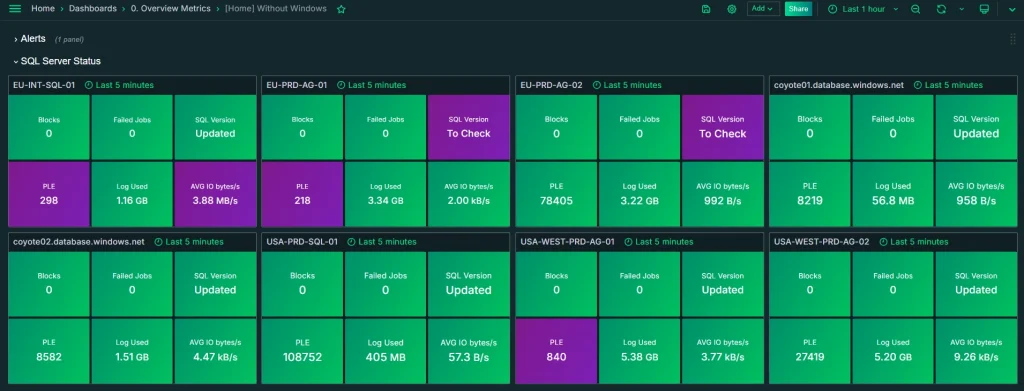
If you manage more than one instance or database — and if you have more than two, you probably have more than five — you need to see the overall state of your entire environment at a glance, not click through servers one by one.
A tool without a consolidated view forces you to multiply the time you spend on routine checks. And when an incident happens, wasting time navigating between individual dashboards can be the difference between resolving it in minutes or in hours.
6. Best practices and configuration assessment
Any experienced DBA knows that most performance problems originate in misconfiguration, not in the code. Wrong max degree of parallelism, instant file initialization disabled, autogrowth set to absurd values, databases with no recent backups — these issues exist in production environments more often than most people would like to admit.
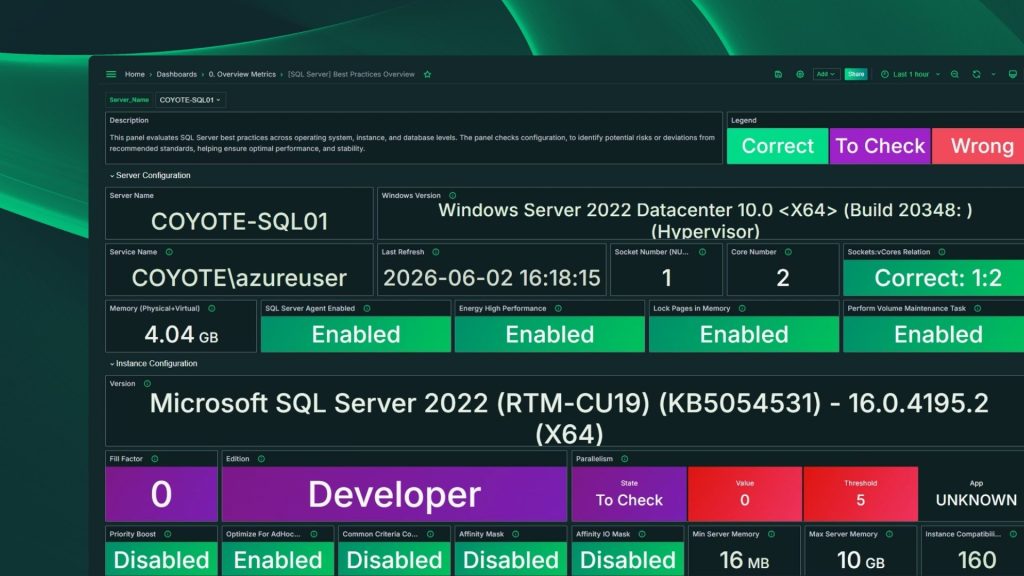
A tool that evaluates your configuration against established best practices and flags what’s wrong saves you hours of manual auditing and helps you prevent problems before they occur.
7. Scalability without the headaches
A tool that works great for 2 instances but becomes a management nightmare for 10 isn’t scalable. As your environment grows, the tool needs to grow with it — without requiring a full reconfiguration or costs that spiral out of control.
The licensing model matters too. Do you pay per instance, per database, per user? Does the price scale reasonably? Can you start small and expand without friction?
Why scripts alone aren’t enough to monitor your databases
Before wrapping up with a recommendation, it’s worth being straight about the most common alternative: homegrown scripts and DMVs.
Scripts are useful and free, and we publish plenty of them on this blog. But they have real, objective limitations:
- No historical data. By the time you investigate, the blocking event is long gone.
- No alerts. You find out about problems when someone calls you, not before.
- They don’t scale. Running scripts manually across 10 or 20 instances simply isn’t viable.
- They require deep expertise. Not everyone on the team can correctly interpret DMV output.
- No global view. Each script gives you one instance at a time.
For an experienced DBA managing one or two instances with the time to do it properly, scripts work. For teams managing larger environments or those who need proactive response capability, they’re not enough.
Coyote Monitor: the database monitoring tool built for your team
Coyote Monitor is the database monitoring tool we built at Aleson ITC with exactly these criteria in mind.
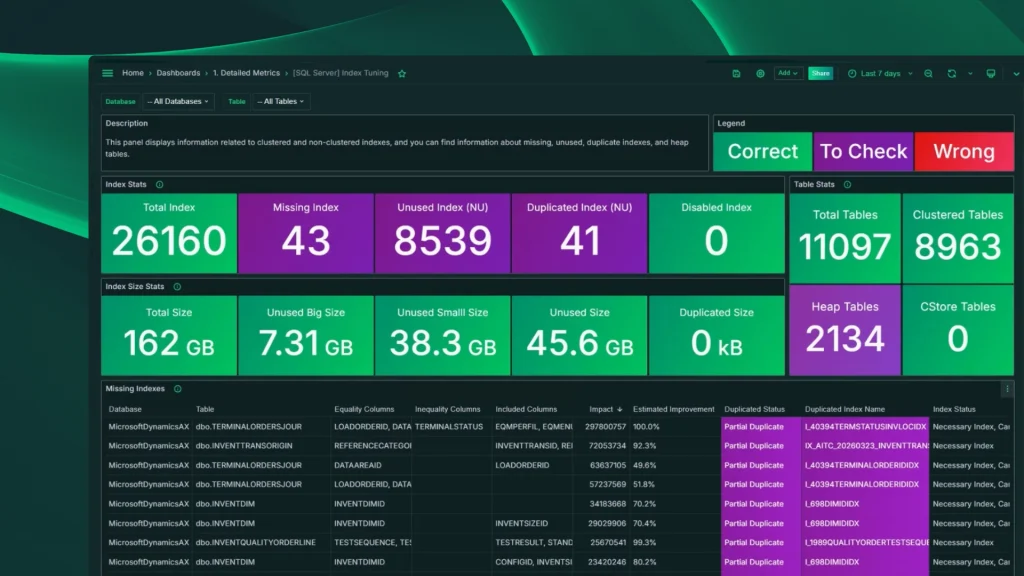
It covers SQL Server on-premises, Azure SQL Database, and Azure SQL Managed Instance natively. It stores historical data on processes, blocking events, performance counters, and database and table growth — so you can investigate what happened, not just what’s happening right now. It has configurable intelligent alerts, a Best Practices panel that automatically evaluates your configuration, and a global view of all your instances. All with minimal impact on your monitored servers.
If you manage production databases and you’re ready to stop fighting fires and start preventing them, Coyote Monitor was built for you.
Frequently asked questions about database monitoring tools
If you’re currently evaluating tools, these are the questions you should be asking every vendor. We’ve included Coyote Monitor’s answers so you have a concrete reference point.
How much historical data does the tool store?
Coyote Monitor stores history for processes, blocking events, performance counters, and database and table growth. The retention period is configurable to fit your environment’s needs — you’re not locked into a fixed window of hours or days.
Does it cover both on-premises and cloud environments natively?
Yes. Coyote Monitor covers SQL Server on-premises, Azure SQL Database, and Azure SQL Managed Instance natively. Each platform has its own dedicated panels and metrics — none of them are treated as second-class citizens.
Are alerts configurable, or are they just generic thresholds?
Alerts in Coyote Monitor are fully configurable to match the real conditions of your environment. It makes no sense to fire the same CPU alert on a reporting server and a critical OLTP server.
What’s the performance impact on monitored servers?
Coyote Monitor is designed with minimal impact as a core requirement, not an afterthought. Metric collection is built to avoid interfering with production workloads.
Is there a global view showing all databases at once?
Yes. The server status summary panel gives you consolidated visibility across your entire environment without having to navigate instance by instance. It’s usually the first thing teams managing multiple servers notice when they start using Coyote Monitor.
Does the tool evaluate configuration against best practices?
Coyote Monitor includes a Best Practices panel that automatically reviews each instance’s configuration and surfaces improvement opportunities. It’s not a static checklist — it’s designed for real production environment.
Does the pricing scale reasonably as the environment grows?
Coyote Monitor is priced per instance or database, with annual or monthly billing. You can start with a single instance on the 30-day free trial and scale without surprises. Pricing is published at darkgoldenrod-kangaroo-572948.hostingersite.com/precios/
Start monitoring today
You can try Coyote Monitor free for 30 days — no credit card required — with one instance or database from your environment.
👉 Start your free 30-day trial
If you’d rather see it in action against an environment like yours first, you can request a demo with our team.