Blocking is one of the most common (and most frustrating) issues DBAs deal with on a daily basis. In this post, I’ll cut straight to the chase: scripts and DMVs to detect blocking in SQL Server, trace the full blocking chain, and pinpoint the query causing the problem.
Let’s get into it.
What is blocking in SQL Server?
Blocking in SQL Server occurs when one session holds a lock on a resource — a row, a page, or a table — and another session needs to access that same resource with an incompatible lock type. The second session waits until the first one releases its lock. This is expected behavior from the engine, not a bug.
The problem arises when those blocks last too long, chain together, or when the blocking session is an open transaction that nobody committed or rolled back.
What is the difference between blocking and a deadlock in SQL Server?
- Blocking is a one-way wait: session A holds a lock and session B waits. B waits indefinitely until A finishes.
- A deadlock is a circular wait: A waits on B, and B waits on A. SQL Server detects this automatically and kills one of the sessions to break the cycle.
Deadlocks are handled by the engine. Regular blocking is not — it stays there until someone intervenes.
How do you check for active blocking in SQL Server?
The fastest way to detect active blocking is to query the sys.dm_exec_requests DMV. The blocking_session_id column tells you if a session is being blocked by another one. If it’s not 0, there’s blocking. You can also use sys.dm_os_waiting_tasks for more detail on wait duration and the affected resource.
The following script combines both sources to give you the full picture: blocked sessions, who’s blocking them, wait type, duration, and the affected query.
SELECT
    r.session_id,
    r.status,
    r.blocking_session_id,
    r.wait_type,
    r.wait_time / 1000 AS wait_seconds,
    r.wait_resource,
    DB_NAME(r.database_id) AS database_name,
    s.login_name,
    s.host_name,
    s.program_name,
    t.text AS sql_text
FROM sys.dm_exec_requests AS r
INNER JOIN sys.dm_exec_sessions AS s
    ON r.session_id = s.session_id
CROSS APPLY sys.dm_exec_sql_text(r.sql_handle) AS t
WHERE r.blocking_session_id <> 0
ORDER BY r.wait_time DESC;| Column | What it tells you |
|---|---|
session_id | The session that is being blocked |
blocking_session_id | The session that is causing the block |
wait_type | The type of wait (LCK_M_S, LCK_M_X, LCK_M_U are the most common) |
wait_time | How long it has been waiting |
wait_resource | The specific resource it’s waiting on |

How do you identify the query causing the blocking?
Once you know which session is blocking, you need to see what it’s doing. The following script retrieves the blocking session’s query, whether it has an active request or is a “sleeping” session with an open transaction:
DECLARE @blocking_spid INT = 87; -- Replace with the blocking_session_id
SELECT
    s.session_id,
    s.login_name,
    s.host_name,
    s.program_name,
    s.status,
    s.last_request_start_time,
    r.command,
    r.wait_type,
    r.open_transaction_count,
    t.text AS sql_text,
    SUBSTRING(
        t.text,
        (r.statement_start_offset / 2) + 1,
        CASE
            WHEN r.statement_end_offset = -1 THEN LEN(t.text)
            ELSE (r.statement_end_offset - r.statement_start_offset) / 2
        END + 1
    ) AS current_statement
FROM sys.dm_exec_sessions AS s
LEFT JOIN sys.dm_exec_connections AS c
    ON s.session_id = c.session_id
LEFT JOIN sys.dm_exec_requests AS r
    ON s.session_id = r.session_id
OUTER APPLY sys.dm_exec_sql_text(COALESCE(r.sql_handle, c.most_recent_sql_handle)) AS t
WHERE s.session_id = @blocking_spid;
Watch out for this detail: the COALESCE(r.sql_handle, c.most_recent_sql_handle) is key. If the blocking session left a transaction open but no longer has an active request (it shows as “sleeping”), r.sql_handle will be NULL and you need most_recent_sql_handle from sys.dm_exec_connections to see the last query it ran.
This scenario — a sleeping session with an open transaction blocking others — is one of the most common and most painful to deal with.
How do you find the full blocking chain and the head blocker?
When multiple sessions are blocked, you’ll usually find a blocking chain: A blocks B, which blocks C, which blocks D. You need to find the head of the chain (the head blocker), because that’s where you need to take action.
The following script uses a recursive CTE to walk the entire chain. It includes sleeping sessions with open transactions:
WITH BlockingChain AS (
    -- Head blockers with an active request
    SELECT
        session_id AS head_blocker,
        session_id,
        blocking_session_id,
        0 AS level
    FROM sys.dm_exec_requests
    WHERE blocking_session_id = 0
        AND session_id IN (
            SELECT blocking_session_id
            FROM sys.dm_exec_requests
            WHERE blocking_session_id <> 0
        )

    UNION ALL

    -- Sleeping head blockers (open transaction, no active request)
    SELECT
        s.session_id AS head_blocker,
        s.session_id,
        CAST(0 AS SMALLINT) AS blocking_session_id,
        0 AS level
    FROM sys.dm_exec_sessions AS s
    WHERE s.session_id IN (
            SELECT blocking_session_id
            FROM sys.dm_exec_requests
            WHERE blocking_session_id <> 0
        )
        AND s.session_id NOT IN (
            SELECT session_id
            FROM sys.dm_exec_requests
        )

    UNION ALL

    -- Recursion
    SELECT
        bc.head_blocker,
        r.session_id,
        r.blocking_session_id,
        bc.level + 1
    FROM sys.dm_exec_requests AS r
    INNER JOIN BlockingChain AS bc
        ON r.blocking_session_id = bc.session_id
    WHERE r.blocking_session_id <> 0
        AND bc.level < 20
)
SELECT
    bc.head_blocker,
    bc.level,
    bc.session_id,
    s.login_name,
    s.host_name,
    s.status,
    DB_NAME(r.database_id) AS database_name,
    t.text AS sql_text,
    r.wait_type,
    r.wait_time / 1000 AS wait_seconds
FROM BlockingChain AS bc
INNER JOIN sys.dm_exec_sessions AS s
    ON bc.session_id = s.session_id
LEFT JOIN sys.dm_exec_requests AS r
    ON bc.session_id = r.session_id
LEFT JOIN sys.dm_exec_connections AS c
    ON bc.session_id = c.session_id
OUTER APPLY sys.dm_exec_sql_text(
    COALESCE(r.sql_handle, c.most_recent_sql_handle)
) AS t
ORDER BY bc.head_blocker, bc.level;
The level column shows depth in the chain: 0 is the head blocker, 1 is sessions directly blocked by it, and so on. If you see 15 sessions chained behind one head blocker, you know it’s urgent.

How do you resolve blocking in SQL Server?
Once you’ve identified the blocking, you have three options:
Wait. If the blocking session is a legitimate process about to finish. Monitor it with percent_complete if it reports progress.
Kill the session. If it’s an orphaned transaction or a process that shouldn’t be there. Be careful: this forces a rollback that can take as long as the original operation.
KILL 87; -- head blocker's session_id
Fix the root cause. Frequent blocking usually points to: transactions that are too long, missing indexes causing table scans on busy tables, inappropriate isolation levels (READ COMMITTED SNAPSHOT can resolve many contention scenarios), or uncontrolled lock escalation. If you see exclusive locks at the table level in sys.dm_tran_locks, you’re likely dealing with escalation.
The limitations of detecting blocking with manual scripts
Everything above works well, but it has real limitations:
You have no history. DMVs only show what’s happening right now. If a block lasted 30 seconds an hour ago, there’s no trace. And if it happened at 3 AM, nobody saw it.
You have no proactive alerts. You find out when a user calls, not before.
It doesn’t scale. If you manage 10 or 50 instances, you can’t run scripts on all of them manually.
You have no cross-context. You can’t correlate blocking with high CPU, disk usage, or performance counters at that same moment.
How Coyote Monitor solves SQL Server blocking monitoring
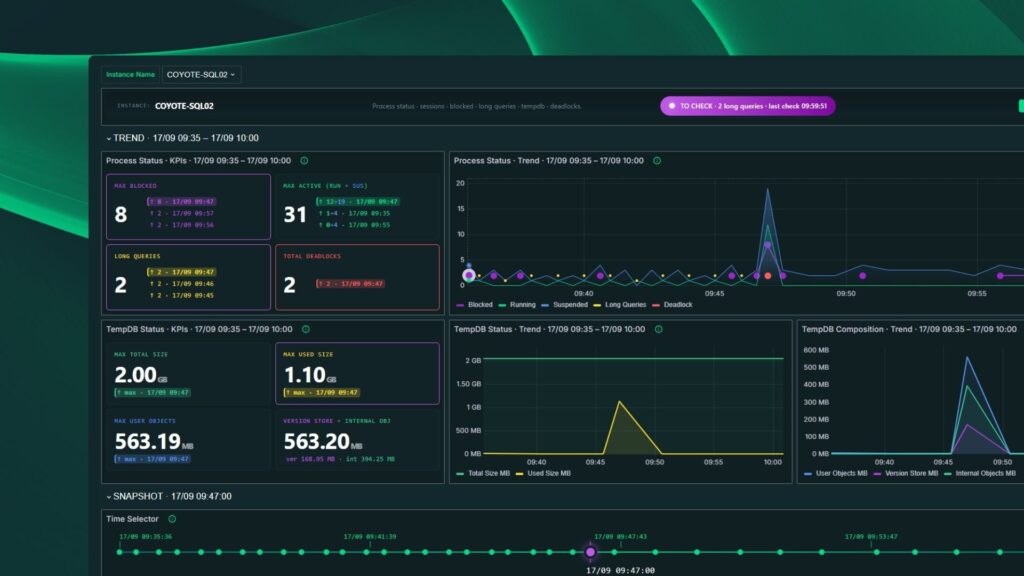
Coyote Monitor keeps a complete history of processes and blocking events across all your instances, continuously and with minimal impact. Whenever blocking occurs — at any hour — you get the full picture: blocking session, blocked session, queries, duration, and affected resource. You can go back in time and see exactly what happened.
Coyote Monitor’s smart alerts notify you when blocking exceeds the threshold you configure, and with processes, blocking, and performance counters in a single dashboard, you can correlate everything to get to the root cause.
👉 Try Coyote Monitor free for 30 days
Frequently asked questions about SQL Server blocking
Which DMV should i use to detect blocking in SQL Server?
The two main DMVs are sys.dm_exec_requests (active requests with blocking_session_id) and sys.dm_os_waiting_tasks (waiting tasks with duration and resource detail). Combine them with sys.dm_exec_sql_text to get the SQL text of the sessions involved.
How do i find the head blocker in a blocking chain?
The head blocker is the session that originates the entire chain: it blocks others but isn’t blocked by anyone. You can identify it with a recursive CTE on sys.dm_exec_requests. The full script is in the “How Do You Find the Full Blocking Chain?” section of this post.
Why can a “sleeping” session cause blocking?
If a session opened a transaction with BEGIN TRAN and never closed it with COMMIT or ROLLBACK, its locks are held indefinitely even though the session shows as sleeping. This is one of the most common causes of prolonged blocking in production.
What is the difference between blocking and a deadlock in SQL Server?
Blocking is a one-way wait (A holds, B waits). A deadlock is a circular wait (A waits on B and B waits on A). SQL Server resolves deadlocks automatically by killing one session. Regular blocking requires manual intervention.
How can i monitor SQL Server blocking continuously?
Manual scripts only provide point-in-time snapshots with no history or alerts. For continuous monitoring with blocking history, proactive alerts, and centralized visibility, you need a tool like Coyote Monitor, which records blocking events automatically across all your instances.